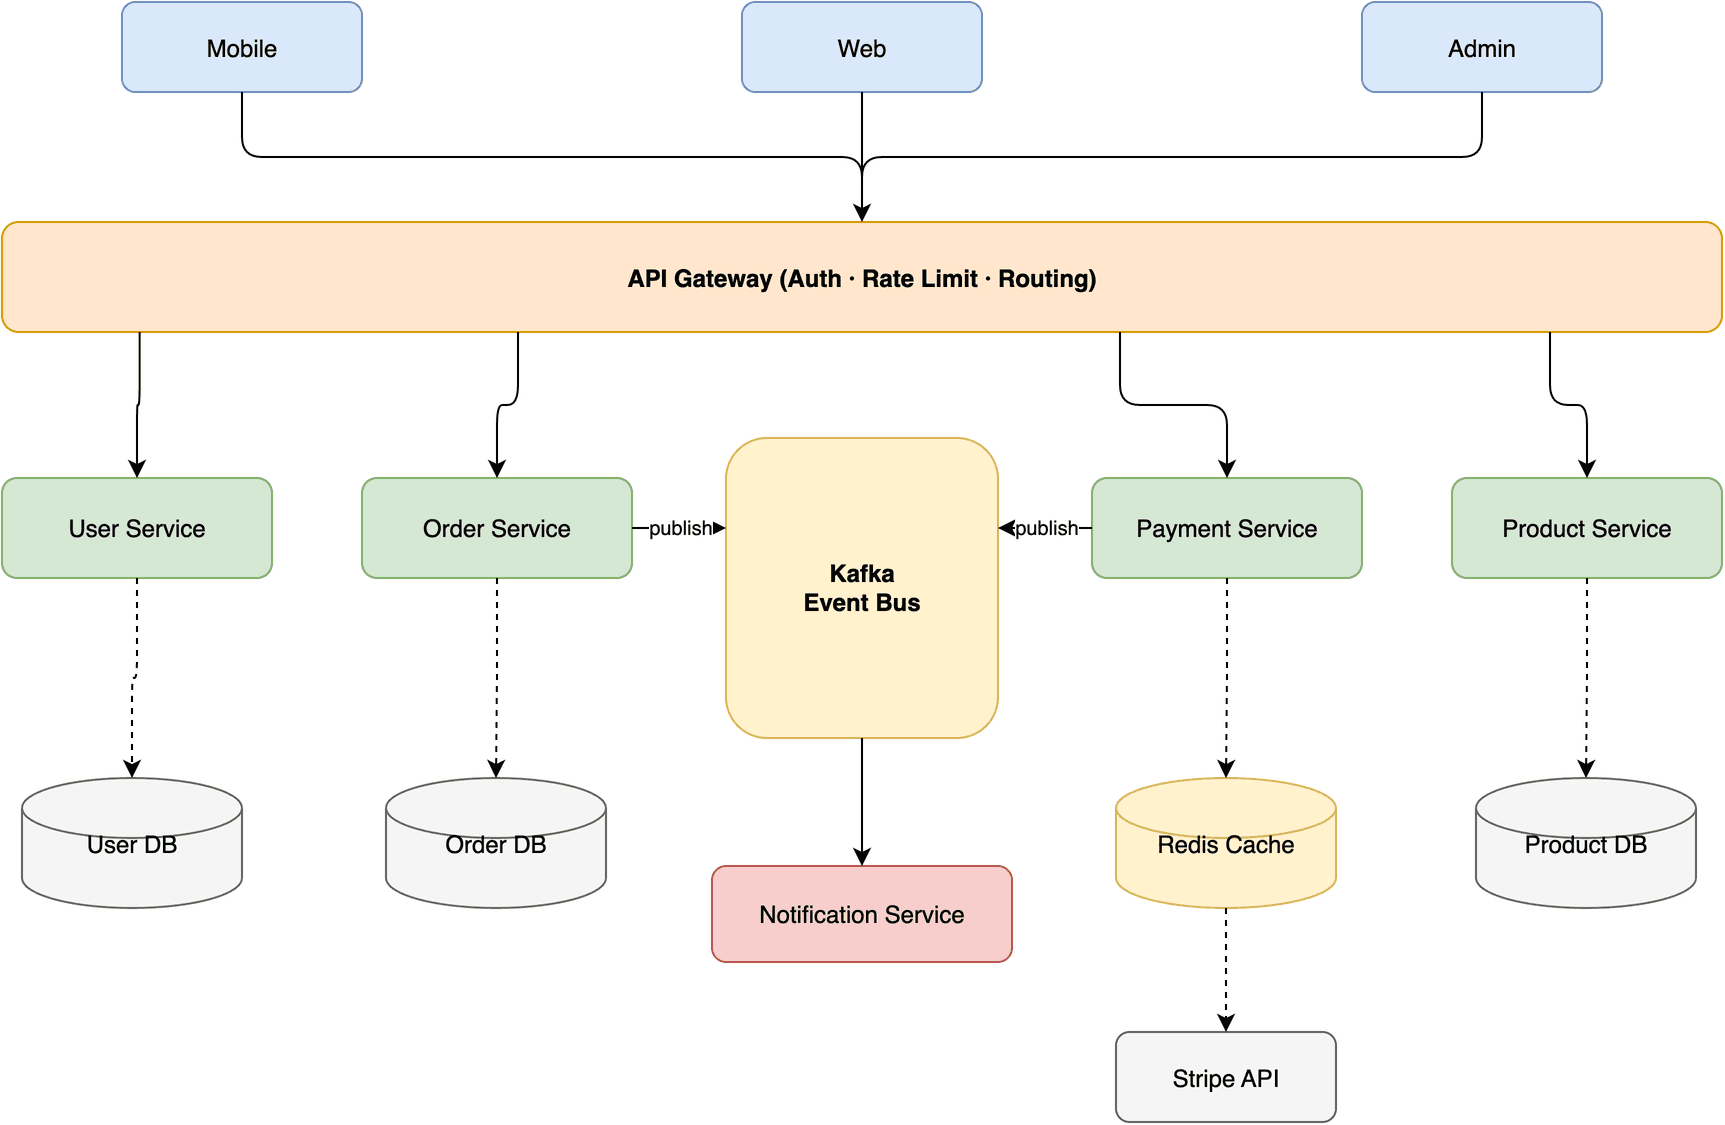
Draw.io Diagrams from Text
Turns a description into an editable draw.io flowchart, mind map or system diagram
by Agents365.ai



by AntV (Ant Group)ConnectorMake visuals
Lets your AI agent turn your numbers into charts, mind maps and flow diagrams
AntV Chart MCP lets an AI agent draw charts from your numbers or a description: bar, line, pie, funnel, word cloud, mind map, flowchart and more, over 25 kinds. The agent returns a link to the finished image.
For People who report numbersAnalystsTeachers and students
The AntV AI Visualization Team, part of Ant Group's AntV project, publishes this open-source connector from Hangzhou, China.
AntV Chart MCP is a connector from Ant Group's AntV team that gives an AI agent more than 25 chart tools. You paste data or describe what you want, and the agent returns a link to a finished chart image: bar, line, pie, funnel, word cloud, mind map, flowchart, org chart and more. You add a few lines to your AI app's MCP settings. It suits people who report numbers and want a chart without opening a chart tool.
One connector covers everyday charts and diagrams such as fishbone, mind map and org chart, and the default rendering service costs nothing.
Start with the first one: it is a small task you can check easily.
Example prompts written by Agent Flows Hub.
From the creator's documentation.
| Toolset | What your agent can do | Access |
|---|---|---|
| Charts | Bar, column, line, area, pie, scatter, radar, funnel and more | AntV rendering service |
| Diagrams | Mind maps, flowcharts, fishbone diagrams, org charts and network graphs | AntV rendering service |
| Word clouds | Shows which words appear most often in a text | AntV rendering service |
| Tables | A spreadsheet view or pivot table of your data | AntV rendering service |
| Maps of China | District, route and pin maps, only for places in China | Chinese map service |
| Own server | Point it at a rendering server you run yourself | Your settings |
Turn a small table of monthly sales into a line chart, or a list of ideas into a mind map, from inside your AI chat. The agent picks a chart tool and returns a link to the finished image.
Notes by Agent Flows Hub (original project name: mcp-server-chart), written from the creator's documentation, not from running it ourselves. mcp-server-chart README (AntV)
Tell us what happened. We take a look first; if it needs paid work, you get an estimate before anything starts.
Turns a description into an editable draw.io flowchart, mind map or system diagram
by Agents365.ai
Turns a table of numbers into a ready-made chart image in seconds
by AntV (Ant Group)
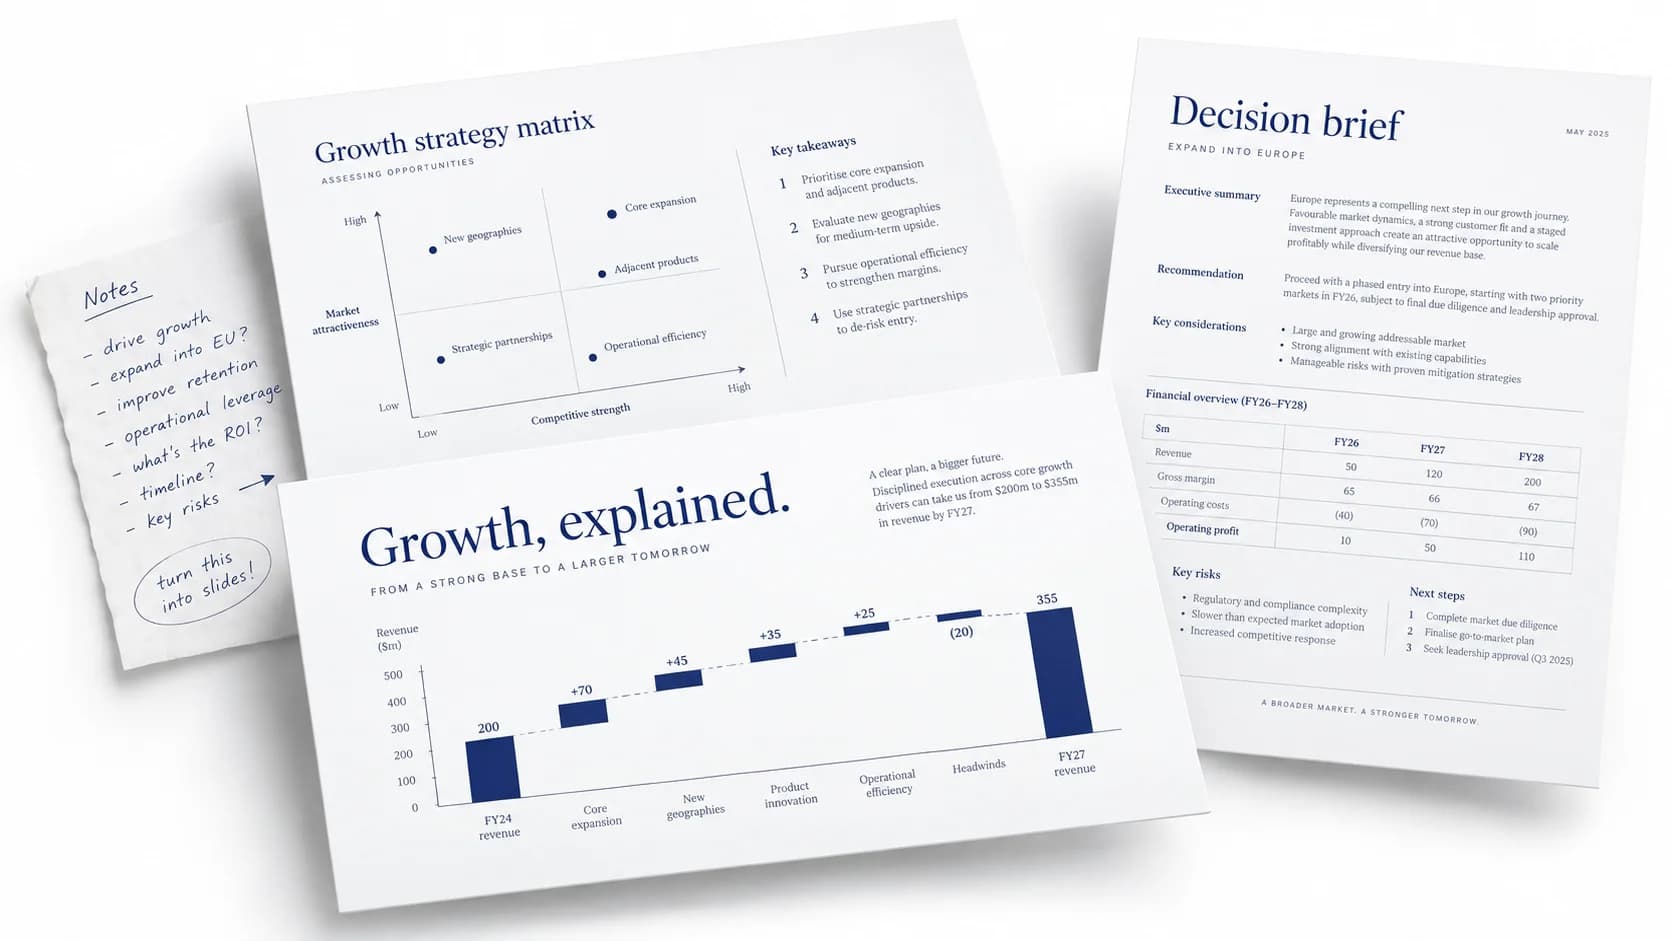
Turns notes and numbers into polished, consulting-style slides and reports
by kgraph57
See all 52 connectors · An MCP server is missing or disconnected